Twitch Viewership Statistics for Horror Games During the Halloween Season

Ah yes, Halloween; the time of the year where everyone dresses up as characters from whatever popular show just finished airing (Squid Game). As we finish with the spookiest time of the year, let's take a look at just how drastically the Halloween season can affect the Twitch charts. As you can imagine, horror games indeed experienced an uptick in viewership. In this article we'll dive further into which horror games received the largest increases in viewership and how the genre improved as a whole.

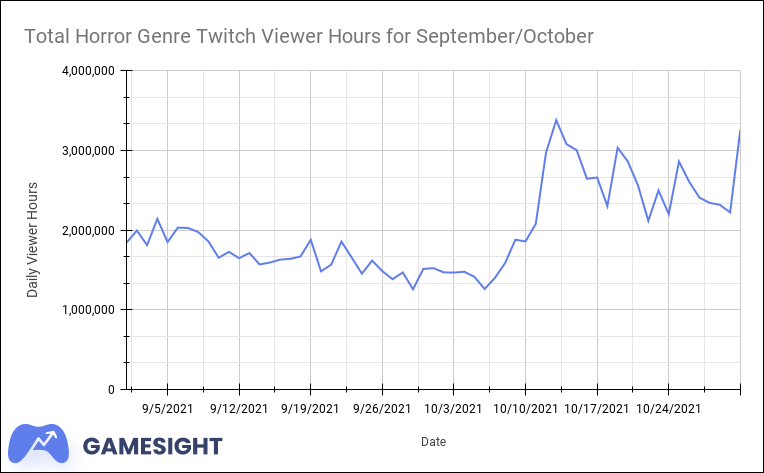
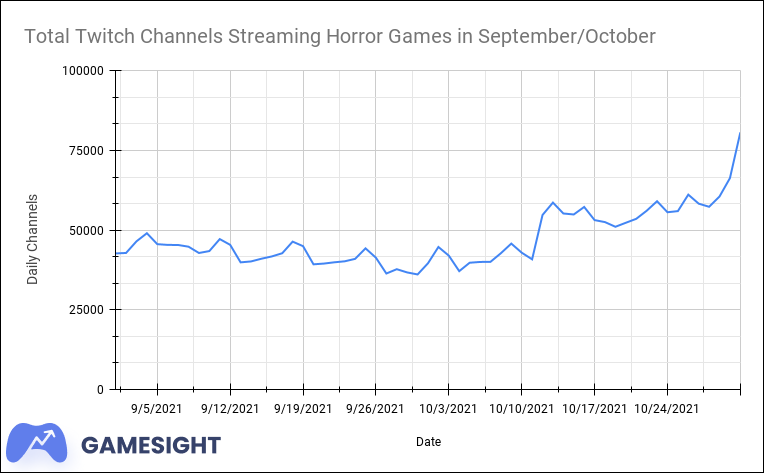
As we can see, horror game viewership received an incredible increase around mid-October. The difference in viewership between September and October is a whopping 38.763% for the entire genre. On the day of Halloween alone there were 3,263,346 hours streamed. Total channels streaming horror games received a similar but smaller percentage increase between September and October as well, resulting in a 25.182% boost, as evident in the graph below:

The graphs follow the same upward trend with a slightly less pronounced spike in mid-October for total channels compared to viewer hours. This usually indicates that there was likely a few larger streamers who played horror games at that time. For many non-concurrently top 25 games on Twitch, viewership spikes are almost always from larger content creators.
Some notable increases in viewership for specific games between September and October include:
Amnesia: The Dark Descent:
388% ACV increase
368% total hours watched increase (259.2k compared to 52.2k)
Amnesia: Rebirth:
253% ACV increase
287% total hours watched increase (47.4k compared to 11.3k)
Dead Space:
94% ACV increase
100% total hours watched increase (332.7k compared to 163.2k)
Dead Space 2:
213% ACV increase
213% total hours watched increase... (213.1k compared to 66k)
Little Nightmares:
138% ACV increase
131% total hours watched increase (398.2k compared to 163.6k)
Little Nightmares II:
100% ACV increase
97% total hours watched increase (407.6k compared to 198.2k)
Resident Evil:
95% ACV increase
105% total hours watched increase (462.9k compared to 221.2k)
Resident Evil 4:
100% ACV increase
102% total hours watched increase (478.4k compared to 231k)
Resident Evil Village:
56% ACV increase
59% total hours watched increase (776k compared to 479.3k)
Until Dawn:
95% ACV increase
86% total hours watched increase (318.6k compared to 163.6k)
Five Nights At Freddy's:
77% ACV increase
82% total hours watched increase (179.6k compared to 96.7k)
Outlast:
48% ACV(Average Concurrent Viewers) increase
53% total hours watched increase (632.2k compared to 408.5k)
Outlast II:
58% ACV increase
63% total hours watched increase (328.4k compared to 199.2k)
Some other interesting tidbits include the fact that since Phasmophobia had such a large resurgence in September, and despite the fact that it still had healthy numbers in October (6.7 million hours watched), it's ACV actually DECREASED 3% from September to October. The same can be said for Dead by Daylight, which also received a decrease of 16% ACV and 17% total hours watched from September to October despite resulting in 23.3 million total hours watched in October. Overall, the numbers for many of the big hitter horror games have increased a marked amount, while the overall genre received a moderate increase.
About us
At Gamesight, we help PC and console marketers implement performance marketing techniques for their games. If you are seeking help setting up and measuring your campaigns, working with influencers, or would like to simply talk with us about this article, please reach out on our website!

